GoodPower Education Fund
Mission
GoodPower empowers humanity to accelerate the global transition to a decarbonized economy. We realize our mission by: shifting culture to transform beliefs, policy, energy and consumer behavior; mobilizing mass civic participation and expanding the electorate; and unlocking the economic power of the renewable energy transition for individuals and communities.
Ruling year
2009
CEO
Leah Qusba
Main address
68 Harrison Ave Ste 605 PMB 961377
Boston, MA 02111-1929 USA
EIN
26-3106566
Communication media
Job services
Agriculture, fishing and forestry
Public utilities
Democracy
NTEE code
Educational Services and Schools - Other (B90)
IRS subsection
501(c)(3) Public Charity
IRS filing requirement
This organization is required to file an IRS Form 990 or 990-EZ.
Tax forms
Communication
Programs and results
What we aim to solve
Energy costs in the US have risen more than 30 percent since 2020. Families are squeezed by higher bills, insurance premiums, and climate-fueled disasters. Globally, billions remain stuck in low-wage, insecure work—one emergency away from crisis. At the same time, disinformation and polarization stall progress on the very solutions that would lower costs and strengthen communities. Renewables are now the cheapest, safest, and most reliable energy in the world. Paired with smart grids, advanced batteries, EVs, and regenerative agriculture—they are cutting costs, creating jobs, and building healthier, more resilient communities. The global energy transition is inevitable. The question is how fast it happens—and who benefits.
Our programs
What are the organization's current programs, how do they measure success, and who do the programs serve?
Good Ideas
This moment calls for creative experiments that can scale to global impact. We’re driven by a culture of innovation in which every member of our team is on the lookout for the next breakthrough program or strategy. New and bold ideas don’t wind up in forgotten folders, they find a home, a testing ground, and a budget in our Better Lab where they’re carefully developed and rigorously tested. This focus on the future has allowed us to develop major new programs including one of the US’s largest youth voter registration operations and a creator community with 6,000 members making content for our campaigns.
Good Food
Regenerative agriculture practices are a win-win. Farmers are often locked into extractive markets that pay them less while costs rise. However, a 2022 General Mills study found farmers using regenerative practices cut fertilizer costs by $50–$100 per acre, while boosting resilience and profitability in this growing market. We envision a food system that puts health, fairness, and affordability first—making nutritious food more affordable, rewarding farmers with increased profitability for regenerative agriculture practices, and shifting consumer culture to increase demand for healthier food.
Good Global
We’re building a better economy globally—powered by renewables and healthier agriculture. GoodPower Global operates with in-country staff and local partners in Brazil, Canada, South Africa, and the United Kingdom — with plans to launch new programs across Asia, Europe, South America and Africa between now and 2030. Our Global Creator Academy employs hundreds of creators across the world who partner with GoodPower to educate local communities about the economic benefits of the global transition to renewable energy and conservation; the cost savings of electrification; the availability iof jobs in the Good For All Economy; the risks of climate disasters, pollution, and petrochemicals; and the health and environmental benefits of regenerative agriculture.
Good Energy
To build an economy that works for all of us, we need a lot more affordable, reliable, safe energy. Global energy demand is increasing costs for families and more frequent extreme weather is costing us in rising insurance premiums, preparation and clean up. In the US, because of the Republican-controlled Congress’ passage of the One Big Beautiful Bill Act, families could see prices increase nearly $200 annually. We’re doing everything within our power to lower costs, create good jobs and advance the renewable energy transition around the world to build an economy that works for all of us — not just the lucky few.
Good Influence
We use strategy, powerful data, and rigorous research to win people back to the truth. The most targeted and vulnerable audiences to disinformation are those our side isn’t speaking with regularly. At GoodPower, we prioritize audiences that others don’t, including rural residents, conspiracy-curious social media scrollers, health-conscious moms, disengaged young people, cost-conscious families, and others — to shift culture and the conversation.
Good Elections
We build political power to secure policy wins. We are creating the political force needed to elect champions who will lower costs, create good-paying jobs, and help unlock the economic benefits of the renewable energy transition.
Where we work
-
Global
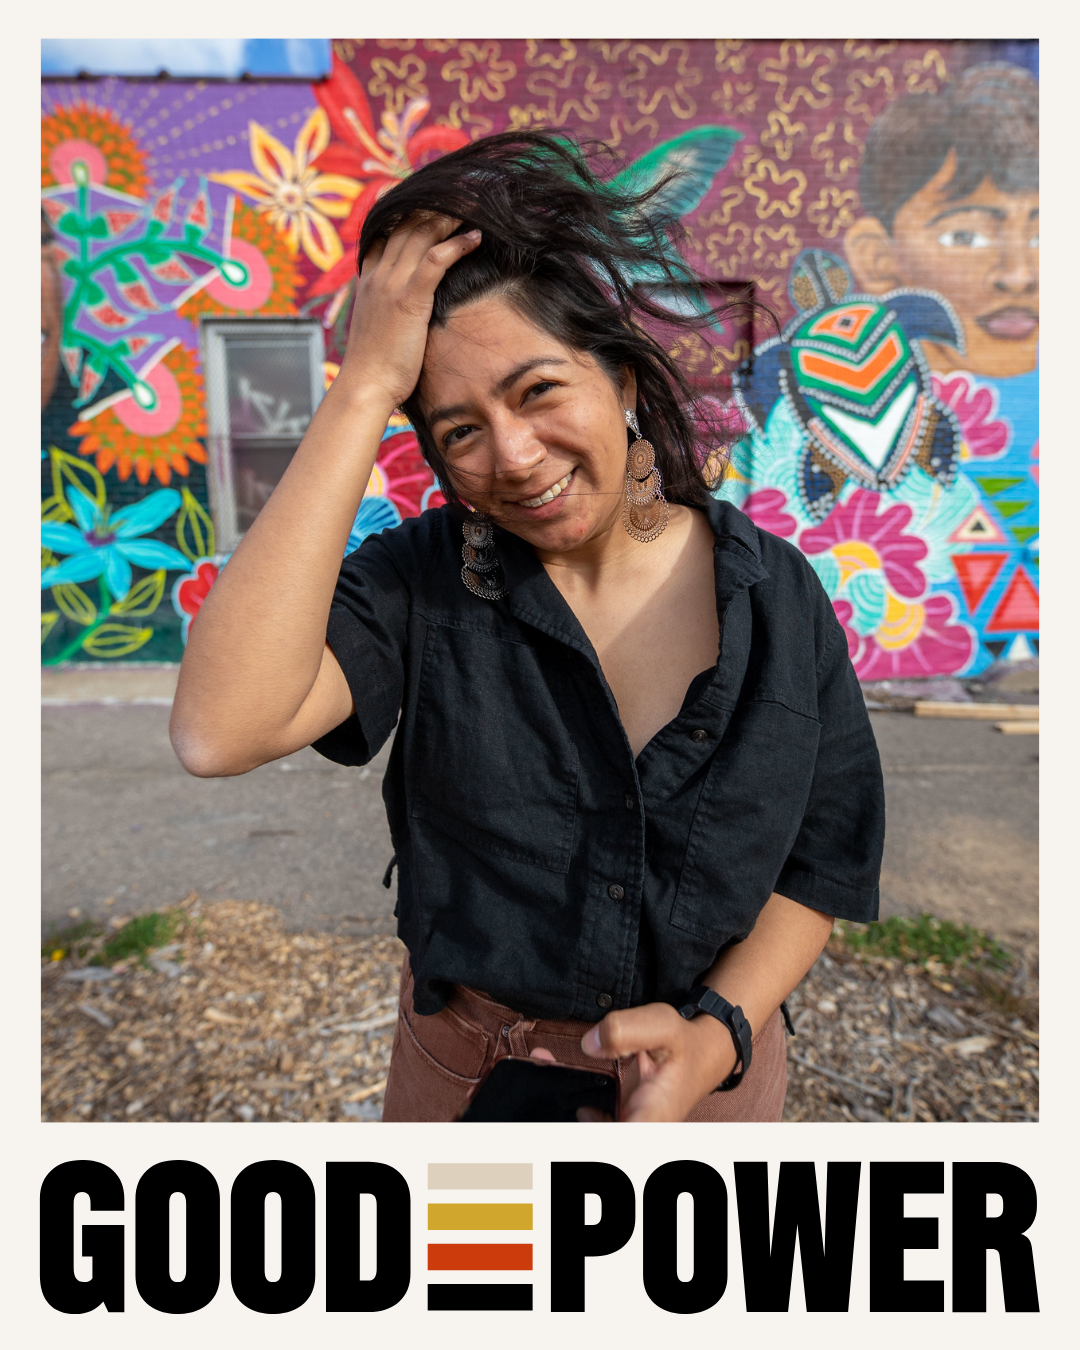
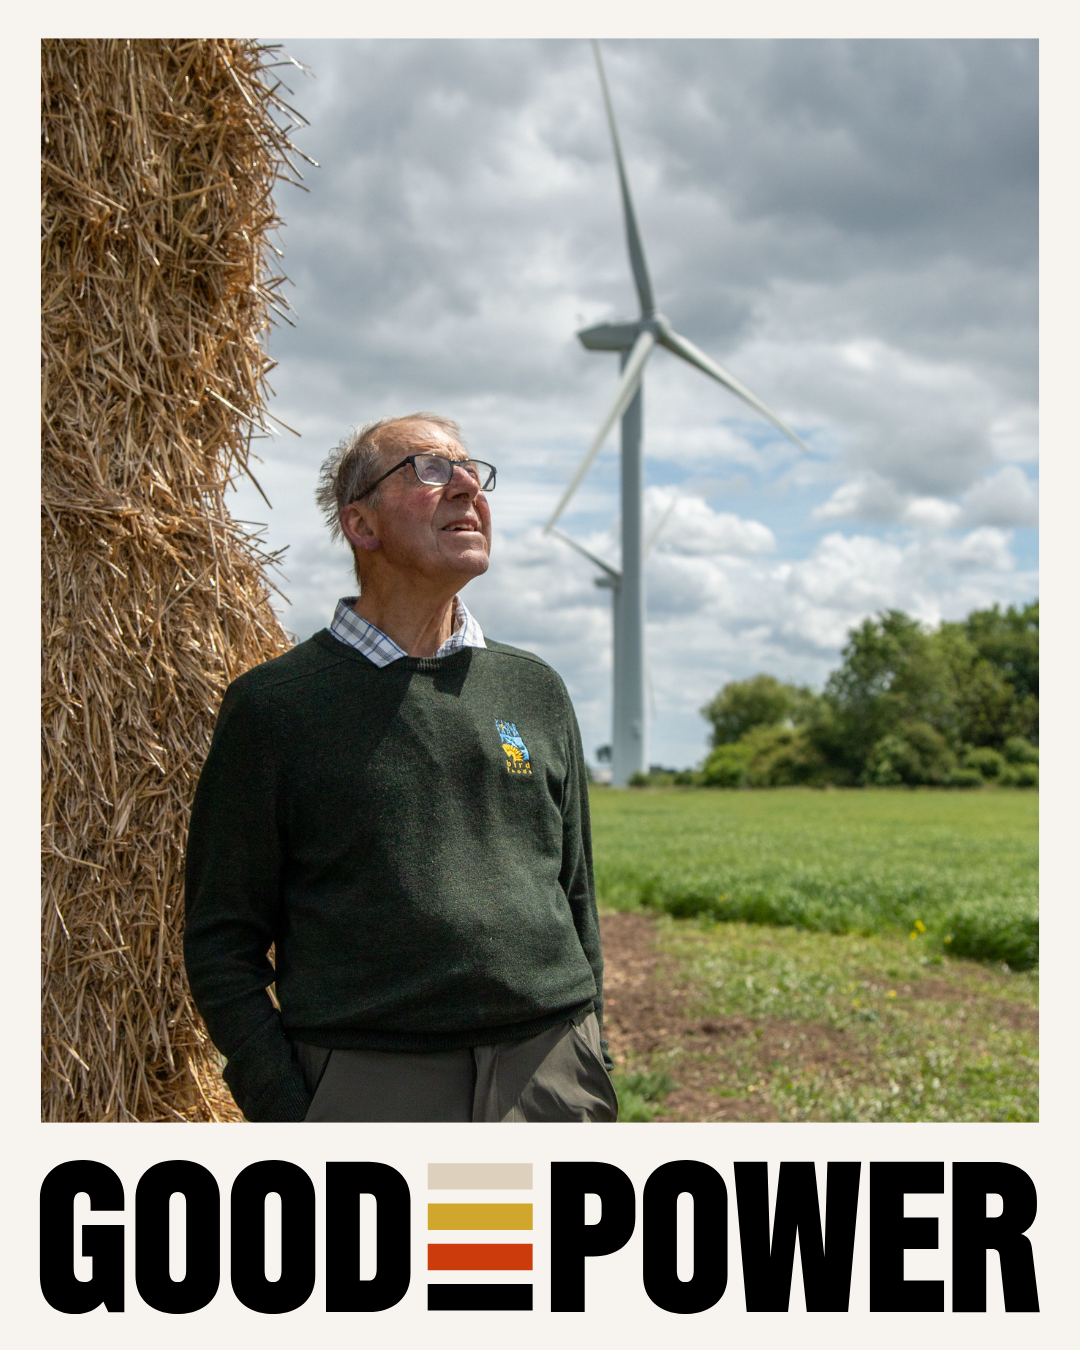
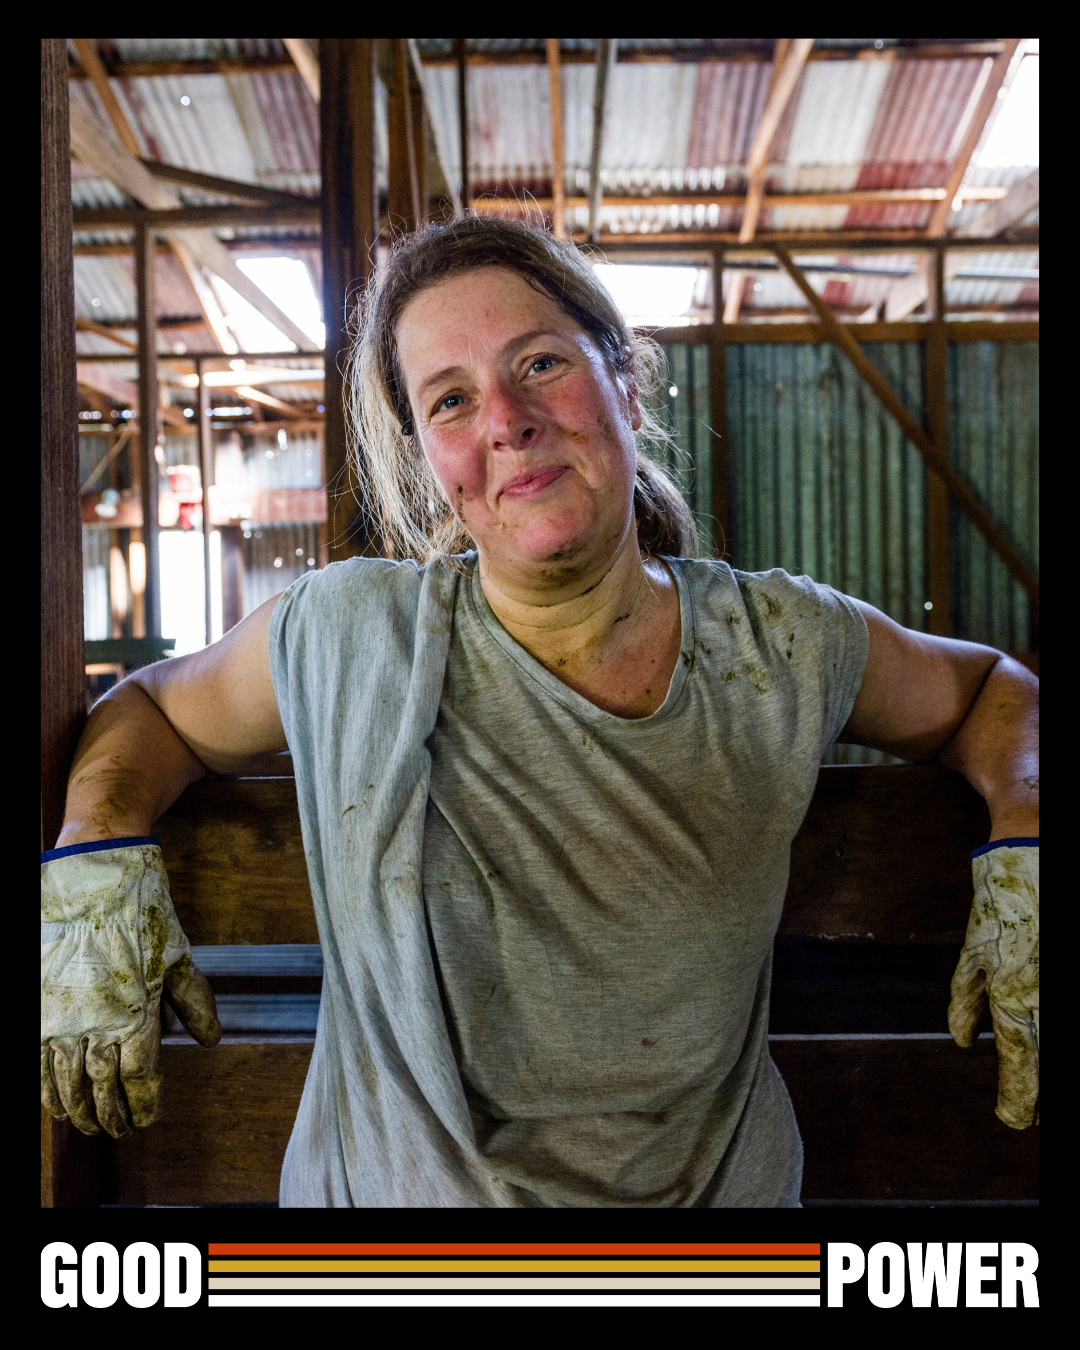
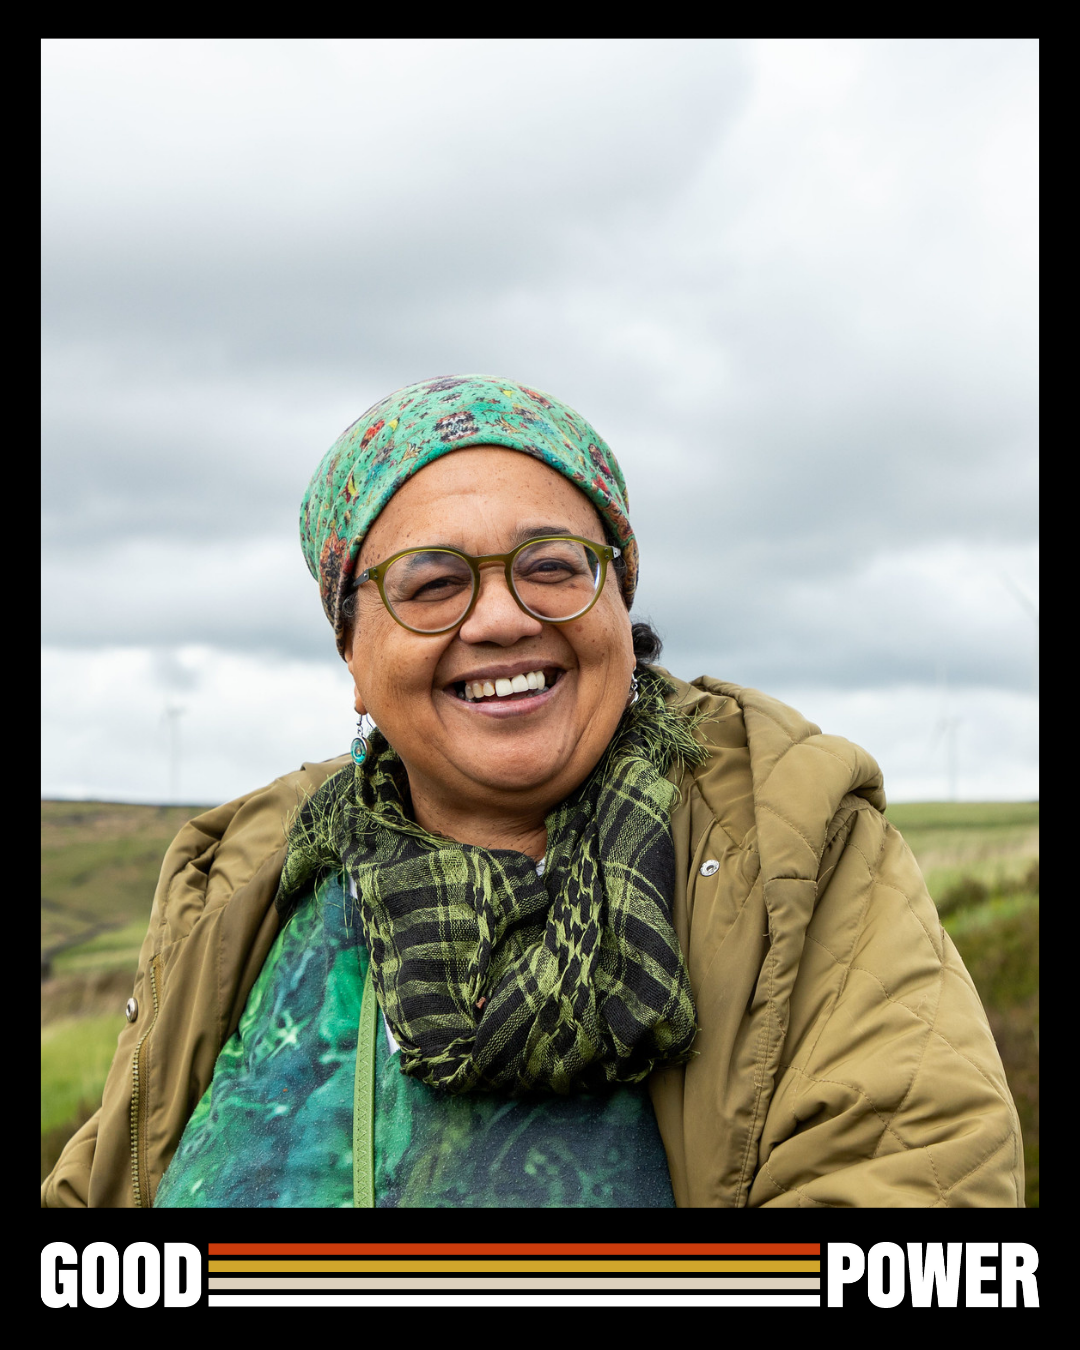
Photos
Videos
Our results
How does this organization measure their results? It's a hard question but an important one.
piece of award-winning AI tech built in-house
This metric is no longer tracked.Totals By Year
Type of Metric
Other - describing something else
major awards for innovation like the GOLD Anthem
This metric is no longer tracked.Totals By Year
Type of Metric
Other - describing something else
local farmers in GoodPower Network
This metric is no longer tracked.Totals By Year
Type of Metric
Other - describing something else
ads served in global markets
This metric is no longer tracked.Totals By Year
Type of Metric
Other - describing something else
countries with in-country GoodPower affiliates and staff
This metric is no longer tracked.Totals By Year
Type of Metric
Other - describing something else
GWs of new renewable energy on its way to construction
This metric is no longer tracked.Totals By Year
Type of Metric
Other - describing something else
local residents acting in support of renewables
This metric is no longer tracked.Totals By Year
Type of Metric
Other - describing something else
ads and organic views to key audiences
This metric is no longer tracked.Totals By Year
Type of Metric
Other - describing something else
followers of our 8,500 content creators
This metric is no longer tracked.Totals By Year
Type of Metric
Other - describing something else
new voters registered since 2020
This metric is no longer tracked.Totals By Year
Type of Metric
Other - describing something else
elections where we are active
This metric is no longer tracked.Totals By Year
Type of Metric
Other - describing something else
stories of farmers diversifying their income streams
This metric is no longer tracked.Totals By Year
Type of Metric
Other - describing something else
Our Sustainable Development Goals


Learn more about Sustainable Development Goals.
Goals & Strategy
Learn about the organization's key goals, strategies, capabilities, and progress.
Charting impact
Four powerful questions that require reflection about what really matters - results.
What is the organization aiming to accomplish?
1. Shift culture to transform beliefs, policy, energy and consumer behavior.
2. Mobilize mass civic participation and expand the electorate.
3. Unlock the economic power of the renewable energy transition for individuals and communities.
What are the organization's key strategies for making this happen?
Communications: GoodPower is a strategic communications juggernaut, combining subject expertise, data, and digital to move minds and engage millions. Over the last decade, we’ve built a world-class marketing tech stack and our 360-degree programs span out-of-home, social, mobile, creators, streaming, and other channels — reaching new audiences that are targeted by disinformation campaigns and that other efforts overlook.
Creators: As a trailblazer in creator marketing and streaming, we remain ahead of the curve as the internet evolves. In 2020, we launched the GoodPower Creator Collective—a network of 8,500+ creators across food, fashion, cars, gaming, sports and more—with 350M+ combined followers. We lead the field in engaging new audiences beyond traditional channels.
Content: Stories are the foundation of our campaigns. The GoodPower Content Studio creates original content that highlights the real economic and health impacts of the Good For All Economy.
Field: We believe an economy that works for everyone is within reach — but only if we unlock it together. GoodPower organizes under-represented voters to advocate for lower bills, better jobs, healthier food, and lasting economic security through the energy transition.
Research: We design and run cutting-edge studies to understand new audiences across geographies, ideologies, and cultures. Our team blends social science, advanced polling, AI-driven analytics, and message testing to identify the most effective ways to counter disinformation, expand public support for decarbonization, and build durable political will.
Innovation: We design and build next-generation platforms including AI and machine learning software, advanced analytics systems, and digital tools. These innovations help us reach people faster, counter disinformation more effectively, and engage communities more deeply. Our team prototypes new campaign models, tests emerging technologies, and develops strategies to stay ahead in a rapidly shifting information environment.
How we listen
Seeking feedback from people served makes programs more responsive and effective. Here’s how this organization is listening.
-
How is your organization using feedback from the people you serve?
To make fundamental changes to our programs and/or operations, To inform the development of new programs/projects, To understand people’s needs and how we can help them achieve their goals,
-
Which of the following feedback practices does your organization routinely carry out?
We engage the people who provide feedback in looking for ways we can improve in response, We act on the feedback we receive, We take steps to get feedback from marginalized or under-represented people, We aim to collect feedback from as many people we serve as possible, We take steps to ensure people feel comfortable being honest with us, We look for patterns in feedback based on demographics (e.g., race, age, gender, etc.),
-
What challenges does the organization face when collecting feedback?
It is difficult to get the people we serve to respond to requests for feedback,
Financials
Financial documents
Download audited financialsRevenue vs. expenses: breakdown
Liquidity in 2025 info
1.50
Months of cash in 2025 info
1.5
Fringe rate in 2025 info
17%
Funding sources info
Assets & liabilities info
Financial data
GoodPower Education Fund
Balance sheetFiscal Year: Jul 01 - Jun 30
The balance sheet gives a snapshot of the financial health of an organization at a particular point in time. An organization's total assets should generally exceed its total liabilities, or it cannot survive long, but the types of assets and liabilities must also be considered. For instance, an organization's current assets (cash, receivables, securities, etc.) should be sufficient to cover its current liabilities (payables, deferred revenue, current year loan, and note payments). Otherwise, the organization may face solvency problems. On the other hand, an organization whose cash and equivalents greatly exceed its current liabilities might not be putting its money to best use.
Operations
The people, governance practices, and partners that make the organization tick.
Documents
CEO
Leah Qusba

Leah Qusba is the Chief Executive Officer of GoodPower, a leading strategic communications, research and campaigning organization advancing the global renewable energy transition. Under her leadership, GoodPower has grown more than 10× in scale and impact, becoming a recognized force for shaping public opinion, accelerating deployment of decarbonization technologies, and unlocking the economic potential of the energy transition.
A visionary strategist, Leah has positioned GoodPower at the cutting edge of media innovation and campaigning. She is widely regarded as an advanced practitioner at the nexus of energy, media, and culture, leveraging modern communications tools to reach across ideological divides and build broad coalitions that drive the energy transition forward.
Number of employees
Source: IRS Form 990
GoodPower Education Fund
Officers, directors, trustees, and key employeesSOURCE: IRS Form 990
Compensation data
GoodPower Education Fund
Highest paid employeesSOURCE: IRS Form 990
Compensation data
GoodPower Education Fund
Board of directorsas of 11/04/2025
Board of directors data
Jonah Sachs DIRECTOR
Free Range Studios
Leilina Patel
Lisa Hoyos DIRECTOR
LCV
Loubna Hadid DIRECTOR
Decenture
Maggie Fox DIRECTOR
Climate Reality Project
Missy Owens DIRECTOR
Coca-Cola Company
Pic Walker DIRECTOR
Spirit Bear Ventures
Tiffani Brown DIRECTOR
Nonprofit Advisor/Foundation Consultant
Board leadership practices
GuideStar worked with BoardSource, the national leader in nonprofit board leadership and governance, to create this section.
-
Board orientation and education
Does the board conduct a formal orientation for new board members and require all board members to sign a written agreement regarding their roles, responsibilities, and expectations? yes -
CEO oversight
Has the board conducted a formal, written assessment of the chief executive within the past year ? Yes -
Ethics and transparency
Have the board and senior staff reviewed the conflict-of-interest policy and completed and signed disclosure statements in the past year? yes -
Board composition
Does the board ensure an inclusive board member recruitment process that results in diversity of thought and leadership? yes -
Board performance
Has the board conducted a formal, written self-assessment of its performance within the past three years? yes
Organizational demographics
Who works and leads organizations that serve our diverse communities? Candid partnered with CHANGE Philanthropy on this demographic section.
Leadership
The organization's leader identifies as:
Race & ethnicity
Gender identity
Transgender Identity
Sexual orientation
Disability
GuideStar Pro Reports

Report successfully added to your cart!
Want more data?
A GuideStar Pro report containing the following information is available for this organization:
- *with the ability to download the data for
Download it now for $125.
Need the ability to download nonprofit data and more advanced search options?Consider a Pro Search subscription.